Statistics Tutor New York, NY for NYU Columbia Baruch Yale Brown

Hire a Statistics Tutor New York for Biostatistics, Probability & Stats, Business Stats, Regression Analysis or Data Analysis.
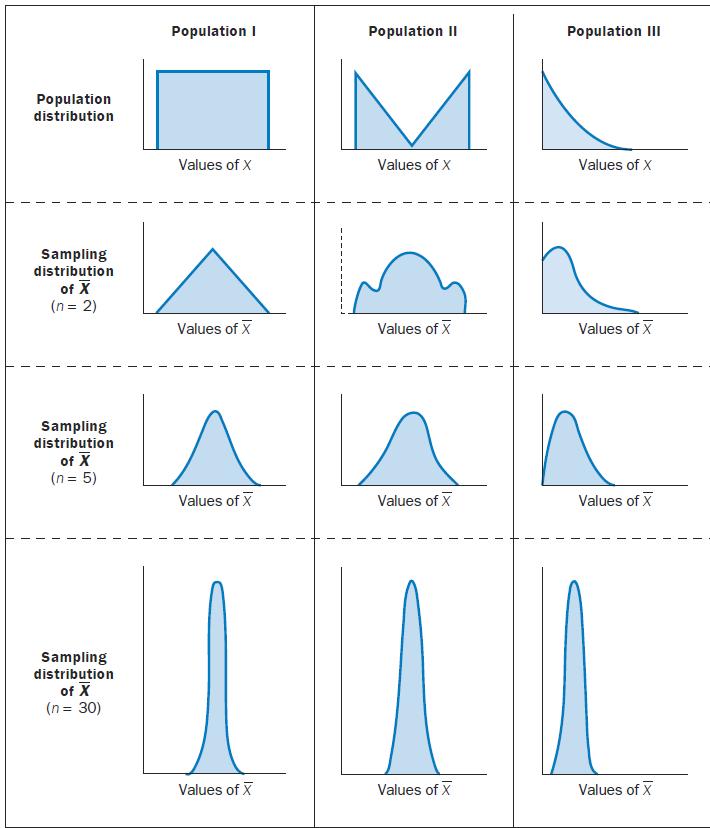
Sampling Distribution of the Mean
The figure above shows a very interesting insight. Population I is a uniform distribution. A distribution is considered uniform if all outcomes are equally likely. For example, the probability of getting a six on rolling a dice. However, when a sample of size two is drawn from this distribution and a mean value is taken the distribution of the mean is no longer uniform. That is, the mean does not take on the distribution of the parent population. Moreover, as the sample size from the uniform distribution increases, the mean of the sample starts to look normal. As the sample size gets larger and larger, the distribution of the mean gets narrower and narrower.
Similarly, for Population II which is again not normal but has two population distributed at two extreme ends. As we draw samples from this population, the distribution of the mean looks normal. As the sample size gets larger, the distribution of the mean becomes more and more normal looking. At n=30, the distribution of the mean is fairly normal and has low variance around the mean.
Central Limit Theorem
The Central Limit Theorem explains this remarkable result. As sample size gets larger, regardless of the distribution of the parent population, the distribution of the mean becomes normal.
Sample statistics: numerical measures computed for data from a sample.
Population parameters: numerical measures computed for data from a population.
Point estimator: sample statistic used to estimate the corresponding population parameter.
 Loading...
Loading...
Measures of Location
Mean: (average value) provides a measure of central location for the data.
 : sample mean; = Σxi/n
 : population mean; = Σxi/N
xi: value of variable x for the ith observation
n: number of observations in a sample
N: number of observations in a population
Weighted Mean: mean computed by giving each observation a weight that reflects its relative importance; weighted sample mean: xx̅= Σwixi/Σwi and weighted population mean: μ = Σwixi/Σwi, where wi/Σwi is the weight for observation i.
Median:
provides a measure of central location for the data. For an odd number of observations, the median is the value in the middle when the data are arranged in ascending order (smallest value to largest value). For an even number of observations, the median is the average of the values for the middle two observations.
Geometric Mean: is used for multiplicative process, for example, to determine the mean rate of change over several successive periods. Applications of the geometric mean to problems in finance, investments and banking are particularly common. Other common applications include changes in populations of species, crop yields, pollution levels, and birth and death rates.
Mode: value that occurs with the greatest frequency. If the greatest frequency occurs at two or more different values, the data set has more than one mode. A data is bimodal if it contains exactly two modes and it is multimodal if it contains more than two modes.
EconTutor has graduate level stats tutors for basic college level statistics to advanced statistics, probability and stats, and biostatistics. Our stats tutors have worked with students from a range of subjects from business statistics, regression analysis, psychometrics, econometrics, and statistical modeling courses. We hire most of our tutors from NYU, Columbia, Yale, Princeton, Brown and UPenn.
Stata Tutor New York
Courses Offered
- Probability & Statistics
- Stats for MBA
- Statistics and Data Analysis
- Stats for Business Ethics
- Biostatistics tutor in New York
- Statistical Inference and Regression NYU Stern
- Stats for Business Music Majors
- AP-Microeconomics-Tutors-newyork
- macroeconomics-tutor-new-york-
- macroeconomics-tutor-nyu-columbia-yale-princeton
- finance-tutor-new-york